
Strategy 2: Define management objectives in relation to ecosystem state

“Defining thresholds and setting precautionary buffers can be viewed as setting the boundaries of a system’s ‘‘safe operating space,’’ in which risk of unwanted regime shift is low and resilience is high” – Selkoe et al. 2015
Background
 Integrating tipping points science into management objectives will help focus and prioritize management actions and inform the design of monitoring systems. A tipping point perspective can be integrated into management objectives from the outset by stipulating that the system needs to stay within a certain range of conditions associated with the desired ecosystem state(s).
There is no one prescription managers must follow to appropriately define their management objectives in a system prone to tipping points. Rather, setting management objectives using a “tipping points lens” entails being aware of the possible regimes, the drivers of those regimes (see Strategy 1), the social preferences that people have for those regimes in their system, and risk tolerance. Because ecological regime shifts are often accompanied by shifts in the ecosystem benefits provided to people, understanding different stakeholders’ preferences for alternative ecosystem states and how tolerant people are of risk is central to setting environmental management objectives and responding to potential regime shifts.
Strategy 2a. Characterize social preferences for ecosystem states
What does this mean?
When people rely heavily on their ecosystem for their well-being, a shift in ecosystem state can mean a shift in the benefits provided to people and, often, who receives them.
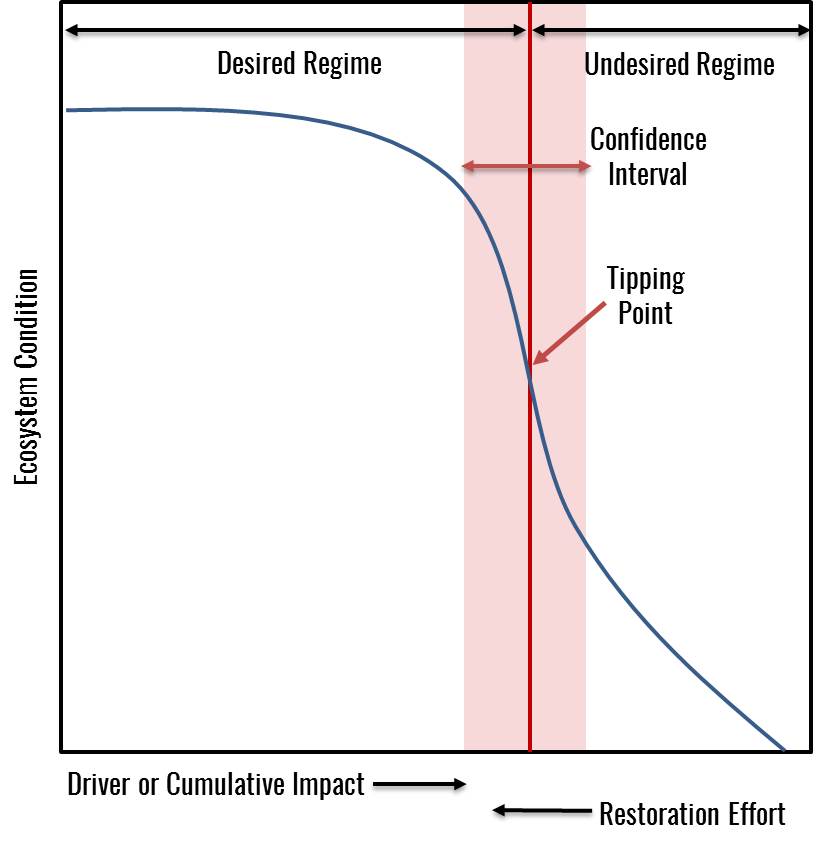
Figure 11, adapted from Selkoe et al. 2015 with permission. In this hypothetical scenario, the area to the left of the tipping point is the desired ecosystem state and right of the tipping point is an undesirable regime, into which the ecosystem may “tip” if driver levels exceed the threshold level.
Sometimes, there will be consensus among all groups about what the preferred ecosystem state is. In other cases, there will be tradeoffs among the preferences of different groups (e.g., conservationists may want to see otters reintroduced and kelp forests restored, while urchin fishermen may oppose reintroduction of otters, which are voracious urchin predators). Ecosystem shifts can lead to some groups benefiting, while others lose out. Revealing the range of views people have for the most preferred state of their ecosystem and who wins and who loses in the case of a regime shift can expose potential sources of conflict as well as opportunities to build consensus.
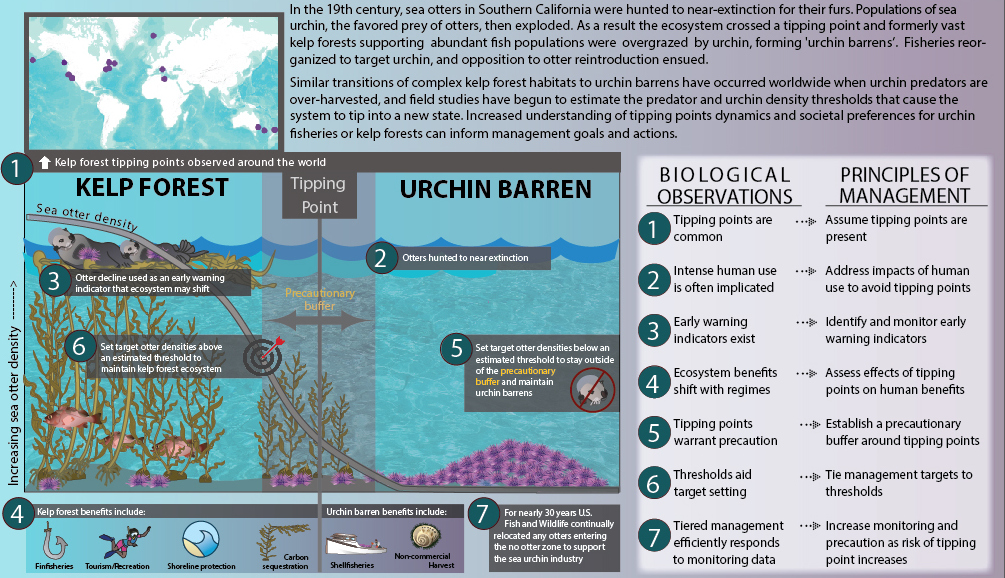
For example, historic overhunting of sea otters for their fur caused localized extinctions of the species throughout its range. The loss of sea otters marks a tipping point for kelp forest habitat by removing the top predator, leading to immense growth in sea urchin populations. High urchin numbers lead to increased grazing pressure on kelp, causing a dramatic shift from a kelp-dominated ecosystem to a barren rock and sediment dominated one. When such tipping points occur, the distribution of ecosystem benefits to humans can shift considerably. Kelp habitats support important commercial fish species and attract diving and snorkeling tourism, and sea otters are valued for wildlife viewing and can increase tourism revenues (Martone et al. in prep). However, in the absence of otters, fishermen that target sea urchins often gain substantial benefits as catches increase. Here the social system has shown that it can adapt to an ecosystem shift, and while conservationists and recreationists may prefer the kelp dominated system, urchin fishermen strongly prefer the urchin dominated one, making the overall socially desired state of the ecosystem less obvious. Furthermore, there are many benefits that might be derived from each ecosystem state, including carbon sequestration, subsistence harvest of invertebrates, commercial finfish harvest, and tourism (Gregr 2016), as well as a number of cultural and social benefits (Chan et al. 2016). This means that different management alternatives will come with very different costs and benefits depending on the sector, increasing the importance of including all stakeholders in clearly articulating the desired state of the ecosystem in any management process (see figure below for more information).
Why is it important?
“Tipping points to me could be a call to action… The community knows; they’ve seen changes, they know that things aren’t like what they used to be.”
- Katie Nalasere, Education Specialist, Hawaii Division of Aquatic Resources, Kauai
 We have found that the tipping point concept facilitates communication among disparate groups and helps stakeholders, scientists, and managers to discuss socio-ecological change in constructive ways. These dramatic and sometimes irreversible changes resonate with people. Taking time to discuss the implications of these shifts, and what they would look like for local communities who depend on these changing ecosystems, can draw out novel information about values and preferences among diverse stakeholders.
In the face of potentially dramatic, abrupt, and often persistent social-ecological change, understanding how stakeholder groups view those changes takes on a greater weight. The costs of such changes will likely not be borne evenly by all groups and may be large and swift, possibly exacerbating inequitable distribution of costs and benefits among stakeholders and sectors.
The governing laws, regulations, and guidance documents under which you operate as a resource manager represent an overarching view of society’s preferences for how the environment and people’s activities should be managed. Gathering more detailed and nuanced understanding of the diverse views of stakeholders may be a requirement of those policies or a desirable addition to the decision-making process.
Engaging user groups to explore tipping point scenarios and discuss the distribution of anticipated costs and benefits across stakeholders can help foster dialogue about equity. Whether you tap into stakeholder preferences through research or through direct participation by stakeholders, you are likely to uncover new knowledge from non-traditional sources. Talking about values and preferences can lead to unexpected management solutions that meet the needs of communities while simultaneously promoting ecosystem health and function. Discussions with stakeholders may lead to new management options, help narrow the set of possible actions, or yield insights into how to frame or communicate your plans.
When tipping points occur in a system the difference between those who benefit and those who suffer in the face of system change can be large. Management processes that enable all relevant stakeholder groups to have a seat at the table may help alleviate or even avoid inequitable outcomes through participatory management.
How do you do it?
Participatory process design and the study of coupled social-ecological systems are both relatively new methods that are continually being refined. Below and in Table 4 we discuss some methods that researchers and managers have used in the past, which could be transferred to other settings. We encourage you to also reach out to social scientists and skilled facilitators working in your region for other ideas and ways to build on existing work.
Table 4. Summary of Potential Methods for Characterizing Values and Preferences for Ecosystem States and the Benefits and Services They Provide (Adapted with permission from Chan et al. 2012):
|
Method |
Source |
Purpose |
Pros |
Cons |
Additional Information/ Sources |
|
Narrative Methods |
Chan et al. 2012 |
Tease out local ecosystem-related values and their connections to activities, ecosystem services, and benefits; elicit qualitative expressions of values, especially place/heritage, spiritual and transformative values |
Particularly appropriate when epistemological norms and methods vary greatly across participants and when value articulation is difficult; circumvents assumptions about local values and ES |
Conversion of narratives to metrics difficult though resolvable in conjunction with Structured Decision- Making (SDM) or Qualitative Comparative Analysis (QCA— Ragin 2008) |
Satterfield 2001, Satterfield and Slovic 2004, Satterfield et al. 2011, Basurto and Speer 2012 |
|
Structured Decision Making (SDM) |
Chan et al. 2012 |
Identify values as statements of what matters and objectives, structuring evaluation of alternatives by expressing means and ends indicators for objectives |
Flexible, multi-metric approach including building of metrics in locally appropriate language, and of performance measures |
Labor intensive; might only be appropriate for valuation and tradeoffs, not entire decision if application context is ES |
Gregory et al. 2001, Keeney and Gregory 2005, Espinosa-Romero et al. 2011, Gregory et al. 2011 |
|
Mental/ |
Chan et al. 2012 |
Tease out lay theories of social-ecological systems (SES), local cause-effect logics more broadly, possibly including ecosystem-level ‘production functions’ |
Ideal for parsing assumptions of constituents in situ when worldviews and epistemological norms differ. Adaptable interview protocols already available |
Less useful when cause-effect SES relationships not primary concerns. Values usually more implicit than explicit in cause-effect outputs |
Kempton et al. 1995, Kempton and Falk 2000, Morgan et al. 2002, Jones et al. 2011 |
|
Paired |
Chan et al. 2012 |
Elicit relative preference weightings or rankings across multiple benefits or scenarios |
Very good for achieving ordinal rankings of value priorities with statistical power when conducted across larger constituencies. Value weights are inferred, rather than directly assigned. Can be used in conjunction with visual material and contextual detail |
Very design intensive; dollar valuations added when necessary via damage schedule; only possible for small numbers of benefits /objects (usually <10); as numbers of benefits increases, so does needed survey length |
Chuenpagdee et al. 2001, Chuenpagdee et al. 2006 |
|
Norm-based |
Chan et al. 2012 |
Elicit statements of broad values and environmental principles (not valuation; generally for value ‘held’ not assigned) |
Widely used and tested protocols across international audiences. Available databases of results at regional and national levels. Can be used to quantify nonlinear preference curves (i.e. social tipping points). |
Values usually spatially nonspecific |
Stern and Dietz 1994, Dunlap et al. 2000; Levin et al 2015 |
|
Discursive |
Chan et al. 2012 |
Make collective choices through expert testimony and discourse (citizen juries use analog of legal juries for significant decisions). Often rely on consensus decisions. |
Format is familiar, allows for expert presentations of information, and careful deliberation on decisions |
Labor intensive, Expensive to run (often run for one or two weeks as does a normal jury). Costs of expert time and travel |
Crosby 1995, O'Hara 1996, Coote and Lenaghan 1997, Spash 2007 |
|
Q method |
Murray et al. 2016, MacDonald et al. 2014 |
Combines interviews, document analysis, individual and small group structured data gathering, and Q factor analysis to systematically explore how individuals perceive subjective (qualitative) information |
Allows participants to raise their own topics rather than categories being imposed by the researcher. Does not require large population samples to obtain statistically valued results. |
Time intensive, so not well suited to cross-sectional or large sample sizes. Not designed for generalization across populations |
McKeown and Thomas 1988, Swedeen 2006, MacDonald et al. 2014, Bacher et al. 2014, Sainsbury and Sumaila 2003 |
|
Contingent Valuation |
Venkastachalam 2004 |
Flexible nonmarket valuation method that is widely used in cost–benefit analysis and environmental impact assessment to elicit the value of an environmental good directly through questions about willingness to pay to have more of a benefit. |
Built on economic theory, yields estimates in common (monetary) metric, powerful method to communicate value |
Some values are difficult to measure in this format, e.g. spiritual value and valuation can be incomplete, biased and uncertain. Often the scenarios described in the studies are unfamiliar, and sometimes unrealistic. |
Venkastachalam 2004, Mitchell and Carson, 1989, Cummings et al. 1986 |
|
Choice- Modeling |
Bennett and Blamey 1999 |
Uses a group of methods to determine preferred options by asking individuals to choose between alternative scenarios that differ in their environmental and social dimensions. |
Allows participants to choose between attribute combinations, rather than attaching direct monetary values to environmental goods that they are not used to valuing. Possible to determine, separately yet simultaneously, the importance of economic, social, and environmental factors. |
Less direct method of eliciting values. When people have a good sense of the value of a particular environmental good, it is best to ask them directly about this value, instead of asking in a circumscribed way. |
Mavsar et al. 2013, Riera and Signorello 2012, Naidoo and Adamowicz 2005, |
 For example, Pacific herring are key species that contribute to cultural, social and economic dimensions of human well-being in Haida Gwaii, British Columbia. To understand the diverse socio-cultural values and practices regarding herring, Poe and colleagues (in prep) worked with the Haida Nation to implement semi-structured interviews with Haida community members. Employing this narrative method helps characterize the potential social impacts of ecological and management changes, both past and future, and helps guide goal-setting for fisheries and ecosystem managers in Haida Gwaii. Specifically, by linking Haida values for and relationships with herring with the spatio-temporal changes in herring populations, they identified potential social-ecological tipping points in the system.
In addition, they used mixed community-based social science research methods to build a definition of sustainability that embeds these elicited socio-cultural values regarding herring on Haida Gwaii. Starting with categories of sustainability and the herring fishery, they developed a set of statements from semi-structured interviews with local people to identify how they define sustainability with respect to their relationships with herring and the marine environment. They then held a set of workshops that implemented “Q-methodology”, where residents of Haida Gwaii were asked to sort this series of statements according to their relevance (Loring et al. in prep). This provided an understanding of the factors that influence perceptions of sustainability in herring fishery and ecosystem management. These statements were further integrated into norm-based preference surveys that allowed the authors to identify anticipated effects of ecological changes on socio-cultural values to aid ecosystem-based decision making for Gwaii Haanas (Levin et al. in prep).
Strategy 2b. Analyze risk of crossing a tipping point and characterize people’s risk tolerance to changes that could result
What does this mean?
Identifying the safe operating space for management decisions involves identifying the likelihood or risk of crossing a tipping point. Risk of undesirable impacts to the ecosystem is a function of both probability of a tipping point occurring and the potential magnitude of its effect.
 Just as people have different preferences for what they want their ecosystems to look like, their tolerance for crossing social and ecological thresholds may vary. Risk tolerance – defined here as willingness to accept the possibility of crossing a tipping point versus accepting precautionary management measures - is related to stakeholders’ values and preferences for different ecosystem states. Thus, decision making includes both the ‘objective’ facts of how systems change and subjective views of the desirability of what is to be gained or lost by a particular decision (Burgman 2005). The role of science is to understand how each ecological change impacts not only the ecosystem, but also the associated economic and cultural systems, how different user groups may benefit or be harmed by these changes, and how risk-averse these different groups are to change, in order to best inform policy development and target setting.
'Risk' can be defined in different ways, depending on how governments, stakeholders, and scientists value the outcomes at stake (Fischhoff 1995). For example, some people care primarily about threats to human life; others care about the economy or the environment as well, and each of these concerns need to be accounted for with different risk estimates. Risk tolerance is often inversely related to the resource’s perceived ecological or social value. That is, decisions to undertake or implement more stringent, restrictive, or expensive risk management measures will gain greater acceptance for highly valued resources than for less valued resources (SETAC 1997).
For example, in Figure 13, Stakeholder A may have values related to the resource, such that they have low tolerance for crossing a tipping point. Thus, they may be supportive of targets that are squarely located in the safe operating space area of the graph. Stakeholder B, however, may have strong values more linked to the driver of change, and thus would be less accepting of precautionary targets and choose targets that fall within the precautionary buffer or even in the zone of uncertainty (confidence interval). Ultimately, identifying people’s values and determining their risk tolerance will help identify management options that represent “acceptable and reasonable risk,” i.e., those that would be viewed as neither under-protective of the resource nor overly burdensome to stakeholders.
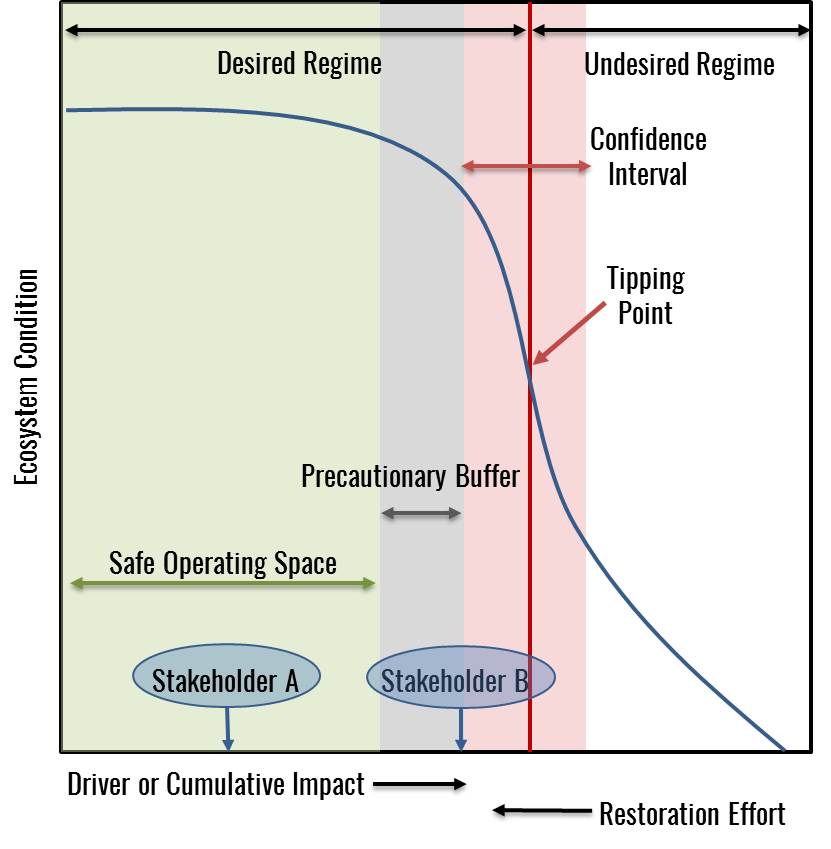
Figure 13, adapted from Selkoe et al. 2015 with permission. Different stakeholders (A and B) exhibit different preferences for acceptable driver or cumulative impact levels given different values and/or underlying risk tolerances.
In the figure below you can find two different real-life applications of the conceptual model developed above – both for kelp forest-urchin barren systems where sea otter populations were rebounding naturally or through active restoration, but where stakeholder preferences differed dramatically. In Scenario A, stakeholder engagement processes determined the management goal to be maintaining an otter-free zone in southern California, USA. In response to strong preferences by urchin fishermen to maintain urchin barrens, and a low tolerance for risk, between 1989 and ca. 2001, the U.S. Fish and Wildlife Service (FWS) captured and moved every otter in southern California that strayed beyond a designated sea otter zone around San Nicolas Island, back to San Nicolas or central California. This objective created a very wide precautionary buffer and a management target set close to zero otters. In Scenario B the management goal was to maintain kelp forests through otter protection. In parts of Alaska, a sea otter recovery management plan sought to maintain a minimum density of otters to support kelp forests and the tourism trade. Otters need habitat that offers protection from orcas, so in response to mounting orca predation, FWS designated critical habitat to protect areas where orca predation success is lowest. This strategy allowed for higher risk tolerance with a narrower precautionary buffer, a larger safe operating space, and a management target aimed at a minimum number of otters (Description and Figure 12 from Selkoe et al. 2015).
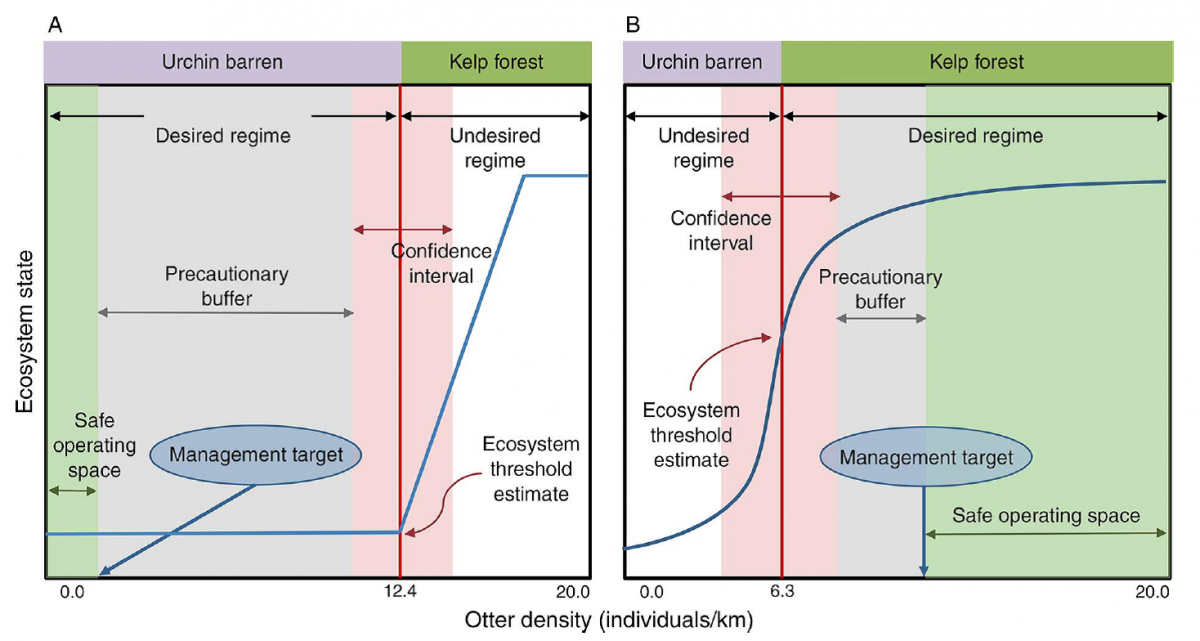
Figure 14, adapted from Selkoe et al. 2015 with permission. Panel A represents the otter exclusion zone maintained in Southern California (from 1989-2001) to protect urchin fisheries from otter predation. The threshold number of otters that can trigger a shift from urchin barren (fishermen’s desired regime) to kelp forest is 12.4 otters/km of coastline. Note the low risk tolerance for otter invasion and loss of urchin barrens. Panel B represents active management for otter restoration and kelp forest recovery, the desired regime in Alaska. Here the threshold for kelp forest recovery is 6.3 otters/km and the management target, in terms of minimum otter density, is close to this number.
Why is it important?
Precautionary regulation is often unpopular, financially costly, or impractical, partly due to economic discounting and underestimation of future risks (Scheffer 2009). However, tipping points change the balance between the costs of action and inaction. The cost of inaction skyrockets in a system that exhibits tipping points as pressure on a system intensifies, compromising resilience and leaving little buffer for the system to absorb unforeseen shocks (Figure 13, adapted from Kelly et al. 2014a). Moreover, many ecosystems tend to include feedback loops that reinforce certain states; if these feedbacks are present and act to maintain the ecosystem in an undesirable state after a tipping point is crossed, restoration costs and the risk of failure also increase.
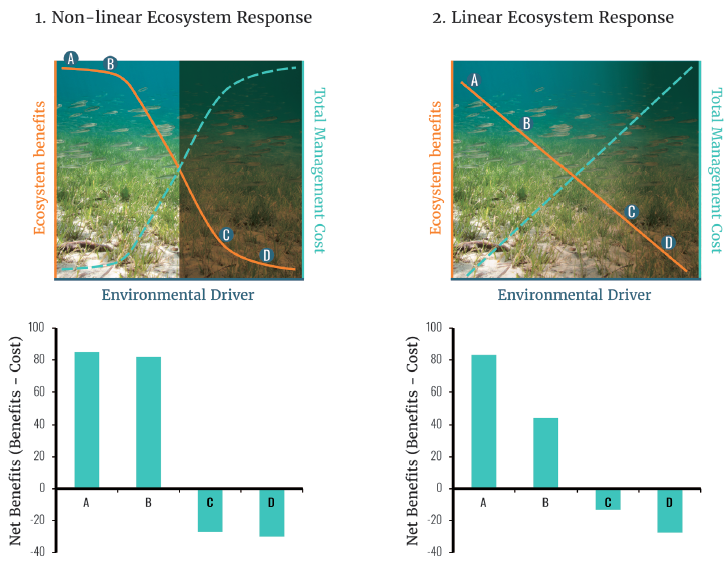
Figure 15, Modified from Kelly et al. 2014. Two hypothetical relationships between ecosystem state (e.g., an unimpaired estuary with clear water vs. an impaired state with algae-dominated, turbid water) and the intensity of a human driver (e.g., nutrient input). In the nonlinear response scenario on the left, a small change in stressor intensity can drive a dramatic change in ecosystem state (e.g., from point “B” to “C” along the solid curve). The dashed curve represents the nonlinear increase in management costs that may result from a threshold change in the ecosystem. This cost curve assumes that management costs increase in step with environmental degradation. Cost for points along the line are shown below. On the right is the linear response case for comparison.
Rigorous cost–benefit analysis can help to inform precautionary target setting and reveal how costs and benefits are distributed among stakeholders to assess equity. Reducing uncertainty through increased information and high risk tolerance may allow managers to approach a system’s tipping point more closely when setting targets. Early action to preserve resilience of a desired state is more practical, affordable, and perhaps effective than late action to prevent a tipping point, or to recover the system, which may require extreme measures (Kelly et al. 2014a).
For example, in some cases, the decision by fisheries managers to set harvest levels below maximum sustainable yield (MSY) has been motivated by boosting precaution in order to avoid severe economic consequences of crossing a tipping point (i.e., stock collapses; Punt et al. 2012). Australia has fully adopted risk-based measures throughout their fisheries management (Smith et al. 2009). Similarly, scientists are calling for managers to significantly reduce take of forage fish below MSY to avoid risk of negative ecological effects for predators that depend on these species (e.g., sea birds, mammals, and commercially valuable larger fish like halibut, salmon, and rockfish; Cury et al. 2011, Hunsicker et al. 2010, Smith et al. 2011, Pikitch 2012).
How do you do it?
Identifying thresholds in the ecosystem can help quantify and communicate the costs and risks of inaction. Capturing people’s preferences and risk tolerance for these changes and the potential for trade-offs among different management actions can then follow. This can be done using a variety of social-science methods, including mental model interviews, choice experiments, and norm-based preference surveys (Described below and summarized in Table 4).
Identifying the drivers of people’s perception of risk is also important for helping to address risk tolerance and evaluate management decisions. Risk perception is linked to its magnitude and consequences, but other factors can also mitigate willingness to accept risk, for example, the level of personal control. In situations where people feel they are in control they will tolerate higher risks (Bergman 2005). People will also tolerate greater risks when they are given a choice versus when risks are imposed. Anchoring, or the tendency to be influenced by initial estimates, can also be a factor that can affect people’s risk tolerance. Social science methods can reveal some of these and other biases and help structure the decision process (Stern and Fineberg 1996, Bergman 2005).
Below are some examples of methods you can use to characterize risk tolerance and identify factors that may influence a stakeholder’s preferences for certain targets or management action.
Evaluating Trade-offs Among Management Decisions
Understanding how ecosystem dynamics respond to different management decisions can allow for examination of the costs and benefits of different management actions.
Ocean Tipping Points researchers examined the consequences of alternative forms of exploitation of Pacific herring off the coast of Haida Gwaii, British Columbia, Canada to achieve sustainable fisheries and conservation goals. First, team members interviewed individuals representing government bodies, conservation groups, and relevant industries to understand what factors influenced risk tolerance. The team then developed formal models to evaluate trade-offs between egg- and adult-harvest rates in relation to environmental variability, risk to fisheries in terms of the probability of fishery closures, and the risk to ecosystems based on the foraging needs of predators reliant upon these exploited stocks (Shelton et al. 2014). They then developed a risk plot comparing the probability of fisheries closure for the two different types of harvest and the ability of the ecosystem to support seabird foraging. This model was then developed into a decision support tool that allows stakeholders to examine how different harvest rates and environmental variability affect the probability of different outcomes for herring stocks and catches, providing further insights into their preferences and risk tolerance.
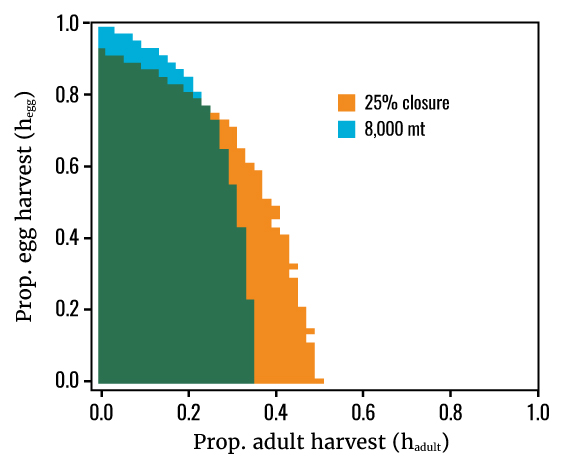
Figure 16, from Shelton et al. 2014. Risk plot comparing the probability of fisheries closure and Becosystem for all combinations of egg and adult harvest. Becosystem is an ecosystem threshold intended to leave enough herring biomass (8,000 mt) in the water to satisfy the needs of herring predators (purple and magenta areas). Many combinations of egg- and adult-harvest rates can allow the herring fishery to remain open at least 75% of the time (peach and magenta areas), while maintaining average herring biomass above Becosystem (magenta area).
Risk Assessment
Risk assessment processes evaluate the likelihood or probability that ecosystem components (e.g., populations, habitats, communities) may suffer adverse impacts as a result of human activities or management actions. Risk assessment and management are widely used and can be applied in a variety of situations, from those with minimal data and resources to those with detailed inventories and complex systems modeling (see Holsman et al. 2017 for a review). Whether qualitative, semi-quantitative, or quantitative, all risk assessment processes include:
- Identifying the sources of risk (drivers);
- Analyzing their consequences;
- Setting risk classes (e.g., high, medium, low risk) based on the exposure to drivers, the and consequences to ecosystem components, (note that this may include consideration of threshold responses);
- Evaluating outcomes from different management options; and
- Identifying risk management strategies.
Qualitative assessments are often based on expert judgment. For example, Hobday and colleagues (2011) describe an approach in which stakeholders evaluate the scale, intensity, and consequence of potential drivers facing ecosystem components. Such an approach could be applicable to thresholds if stakeholders and experts characterize the consequence of drivers as non-linear. For semi-quantitative and quantitative risk assessment methods, threshold-based science presents a unique opportunity to identify the degree of impact from a driver on the ecosystem and ultimately the services and functions provided by these ecosystems. The relationships between both ecological components and drivers between components and the functions they provide are often non-linear, which can provide natural inflection points from which boundaries between impact or risk classes can be determined (Figure 17).
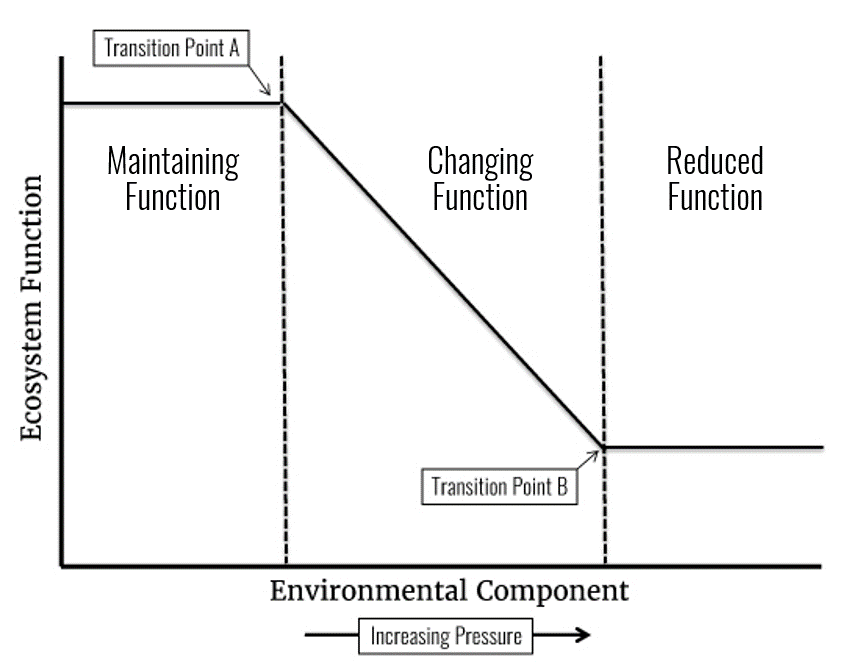
Figure 17, Adapted from DFO (2015). The relationship between ecological components and the functions they provide in the ecosystem with categories that underlie risk of impacts to ecosystem components and their ecosystem functions. As the level of impact to ecosystem function increases, the ecosystem component moves from “Maintaining Function” towards “Changing Function” and “Reduced Function” categories. These are described as the following: “Maintaining Function” – the ecosystem component resists or compensates in the face of perturbation so that ecosystem function is maintained although there may be changes in the status of the ecosystem component; “Changing Function” - ecosystem function systematically changes as the ecosystem component changes with perturbation, such that a period of altered status of the component is expected but recovery of the ecosystem component is expected to occur; and, “Reduced Function” - the ecosystem component has reached a status where evidence indicates that the function can no longer be provided or where recovery is no longer secure. The shifts from one category to another indicate transition points that may be used as limits or targets, depending on the trajectory of change.
Risk assessments should be able to identify the effect of multiple, interacting drivers and abrupt and non-linear changes in ecosystem components (Levin & Mollman 2014). If sufficient data and understanding of ecosystem dynamics are available, quantitative relationships between drivers and ecosystem components can be used to estimate risk (e.g., Stelzenmuller et al. 2010; Burgess et al. 2013; Fulton et al. 2014; Holsman et al. 2017). If insufficient data are available to parameterize models, qualitative or semi-quantitative methods such as the Comprehensive Assessment of Risk to Ecosystems (CARE) method can be used to combine available data with local knowledge to assess risk from individual drivers and the cumulative risk from several drivers, This method can also incorporate qualitative understanding of how different drivers interact to generate improved estimates of risk.
Once relationships between drivers and ecosystem components and the potential ecological risks are determined, whether qualitatively or quantitatively, risk tolerance of different stakeholders should be identified. In risk assessment processes, this can be done using collaborative decision processes to set the boundaries between risk classes (e.g., very high, high, moderate, low, very low) or, if risk classes are pre-determined (for example, based on ecological thresholds or limits), by using social science methods that identify stakeholders’ willingness to be in a particular risk class. We describe some of these methods below.
 Social science methods to identify people’s perceptions of risks and benefits of decisions
A variety of economic and social science methods are available to help you understand people’s judgments of risks and the desirability of different states. The first step is to identify the elements that influence people’s perceptions of costs and benefits. This can be done using Mental Model Interviews to reveal each individual’s intuitive understanding of how a process works and the factors that are important to people’s perception of risks and benefits (Morgan et al. 2002). Other methods include workshops (e.g. Donatuto et al. 2014), systematic surveys (e.g. Safford et al. 2014), or economic value elicitation methods (e.g., Carson et al 2001, Christie et al. 2006). These types of approaches are critical to identifying all the relevant elements within a process, including options, values, outcomes and uncertainties. Obtaining this information helps to avoid some of the biases that could arise when developing formal models without input from stakeholders. Once the key beliefs and elements are identified, the next step is to identify people’s willingness to accept the ecosystem states and the management decisions that lead to those costs and benefits. Follow up experiments can then assess the role of specific factors in affecting people’s values and willingness to accept decisions, (e.g., context, demography, identity).
For example, Wong-Parodi et al. (2016) used a mix of methods to understand people’s willingness to accept different management options to respond to anticipated sea level rise. The team employed structured interviews using Surging Seas decision aid, which allowed participants to visualize and conceptualize the probability and impact of severe flooding events. Digging deeper, they followed these interviews with an experiment to determine if political identity influenced people’s judgments and willingness to accept management options in the context of decisions about buying a home in an area subject to sea-level rise. The authors found that once immersed in a particular decision, participants with different political views responded similarly, except when a strong appeal to their political identity was embedded in the task. By understanding these differences and revealing them, one can incorporate appropriate structures into the decision process to address cognitive biases, increasing transparency.