Strategy 4: Evaluate management scenarios and select a course of action
“Ultimately, understanding shifts between ecosystem states, particularly given interacting and changing stressors, requires getting comfortable with estimation and prediction, and investing in good data. Ongoing research on effective system indicators, costs of management action or inaction, and societal preferences and trade-offs among management options will continue to generate new insights into how best to manage ecosystems prone to tipping points.” – Selkoe et al. 2015
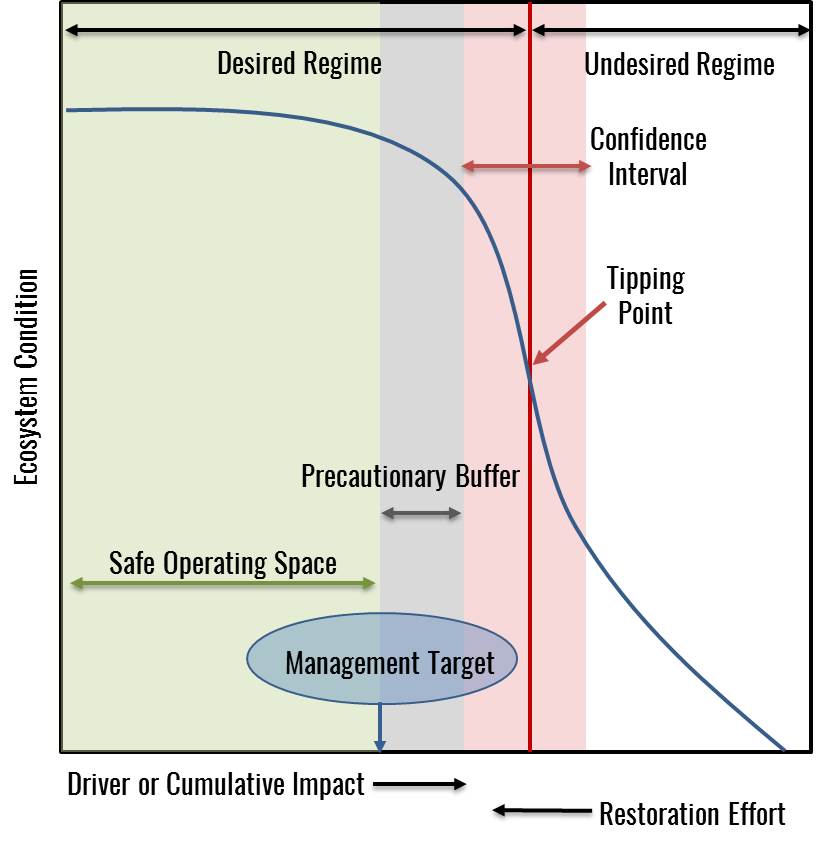
Figure 23, adapted from Selkoe et al. 2015 with permission. Management target is set outside the precautionary buffer to avoid undesirable tipping points while maximizing ecosystem benefits accruing from the driver being managed.
Background
Once you have a clearly defined set of objectives, benchmarks, and targets you are trying to reach, and limits to avoid, it is time to decide on a course of action. Here we build on Strategies 1, 2, and 3 to use the information that has been gleaned throughout the process to take management action.
What set of strategies will help you to reach your goals? In the face of uncertainty and complexity, scenario analysis can help you weigh the costs and benefits (aka tradeoffs) of different alternative management actions. Depending on your particular policy context, it may be useful (or requisite) to evaluate the anticipated ecological, social, economic, and cultural impacts of any proposed action or plan across multiple species, habitats, and stakeholder groups. For systems prone to tipping points, the challenge is to do so while also specifically evaluating whether the alternatives under consideration can reduce the chances of crossing undesirable tipping points or enhance the chances of recovery. Such scenario evaluation may range from qualitative to quantitative analysis, depending on your team’s technical capacity and access to data and what is appropriate to the management decision under consideration (See Figure 23 above).
Strategy 4a. Develop potential future management scenarios and choose appropriate decision support tools to evaluate them
What does this mean?
Scenario analyses allow for the development of a range of potential future scenarios and trajectories due to social and ecological changes. These scenarios can then be investigated with both qualitative and quantitative methods. They can be developed to encourage dialogue among user groups about the benefits and challenges associated with different future scenarios and thus require information on how ecosystems and social components interact (Collins et al. 2011).
 Scenario analysis can help identify the costs and benefits of different alternative management actions and can be an especially powerful decision tool in ecosystems prone to tipping points (Levin and Mollmann 2014). In such systems, scenario analysis allows you to explore alternative perspectives about thresholds, feedbacks, and system resilience, and gain insight into the potential consequences that may occur with abrupt or non-linear changes. Ecosystems that experience tipping points often surprise scientists and managers, and thus ‘what-if’ scenarios offer a useful approach for analyzing consequences of abrupt social-ecological changes.
Where social-ecological thresholds exist, cost-benefit analysis can also assist in the decision-making process and may push managers to prioritize precautionary actions that result in economically or socially beneficial ecosystem outcomes. Where the cost-benefit relationship is linear, there is no obvious policy choice—each unit of cost will yield a consistent amount of benefit, and the agency must decide among alternatives solely based on social preferences and values. Conversely, where a nonlinear relationship exists between the costs and benefits of action alternatives, cost-benefit analyses can help to identify alternatives that provide the greatest benefit at the least cost.
In the case of nonlinear ecosystem responses, the costs and benefits of management actions may also change nonlinearly as that threshold is approached (Kelly et al. 2014). Here, cost-benefit analyses can provide agencies with a dual incentive to implement threshold-based management: both carrot and stick. The carrot is a management action that accounts for a more cost-effective economic threshold; the stick is often an existing regulatory requirement to conduct a cost-benefit analysis under certain statutes. The usual caveats apply: costs associated with restricting economic activity that may generate risks to ecosystems and ecosystem services are often highly salient and relatively easy to quantify, while benefits are often not salient and difficult to quantify, exacerbating discount rates and failure to adequately consider non-market costs and benefits.
Tradeoff analysis can be another powerful tool that incorporates scenario and cost-benefit information into the process and can help managers understand potential resource use conflicts and stakeholder priorities (Lester et al. 2013). Trade-off analysis allows stakeholders to engage in management decision-making by evaluating the benefits and costs of different potential management strategies across multiple sectors or ecosystem services (White et al. 2012, Lester et al. in review). Quantifying the tradeoffs can help determine management priorities and options. It begins with identifying stakeholders and their interests, which inform different potential future scenarios, and then this information can be fed into a multi-criteria analysis which can rank the alternative future management scenarios from least to most socially preferred (e.g., Brown et al. 2001)
Given adequate information, such analyses can allow an agency to maximize benefit, minimize cost, and closely match economic decisions to environmental impacts on the ground. Moreover, such analyses may serve as a simple translation device for natural scientists to communicate the complexity of ecological thresholds to decision makers in a digestible manner.
Why is it important?
Deploying tools like scenario testing, tradeoff analysis, and cost-benefit analysis can save time and money by ruling out ineffective or inefficient strategies based on evidence. Where they exist, these tools can also reveal win-win solutions. And where tradeoffs exist, comprehensive analysis has been shown to focus attention on true (versus perceived) tradeoffs, which can help to defuse conflict. It may also help managers and stakeholders cope with uncertainty: exploring a range of future scenarios can help you to evaluate how robust your strategies are in the face of uncertainty. Such analysis may also provide insight into which strategies will be most resilient or adaptable in the face of future change.
How do you do it?
The first step in developing management scenarios is to identify the potential management alternatives that are most likely to keep your system within the ‘safe operating space'. This step builds off of the science and decision-making processes we reviewed in Strategies 1, 2 and 3. Key questions to ask to help you apply and expand the knowledge gleaned throughout these previous steps include:
- Which drivers are within your influence and what management decisions can you make to affect them?
- What set of options do you have at hand to avoid crossing undesirable tipping points or to increase the chance of crossing desirable ones?
- What stakeholders and sectors may be affected by the management decisions under consideration and what ecosystem functions, goods and services do they value and depend upon?
Depending on how comprehensive your scenario analysis process is, you may be able to consider all possible options (e.g., all possible spatial configurations in an ocean planning exercise) or a smaller set of alternatives.
The second step is to decide on your planning and decision-making time horizons. Questions to ask include:
- Are you considering a short-term decision, such as a fishing quota that will last through a season, or a longer-term decision, such as an area designation that may be in place for years?
- How far out into the future do you want to consider when weighing the tradeoffs associated with different actions you could take?
For example, when planning for new offshore development, you may want to consider how the infrastructure will affect the environment and existing users over its foreseeable lifetime. If climate change is a potential driver of ecosystem state change in your region you may want to forecast its effects over the coming decades and assess how best to adapt your management through time.
Third, consider whether there are different potential future conditions to evaluate in the plan. Again this will incorporate the information that has been gathered throughout the planning phase and will rely heavily on Strategy 2 (“Define management objectives in relation to ecosystem state”). We want plans and actions that can be robust to a range of socioeconomic and environmental conditions. The longer the management decision-making time horizon, the wider that range of future states might be. In a system that is prone to tipping points, this is particularly important, because those conditions can change dramatically in a short period of time. It is valuable then to evaluate management strategies under a range of likely possible futures to see how they perform or how they would need to be adapted to continue to meet your management objectives.
This can be done with discrete scenario testing (i.e., comparing how a strategy performs under Future State A versus Future State B), with a dynamic model(s) that can simulate fluctuating future conditions, or a combination of the two. As an example, the Millennium Ecosystem Assessment used a qualitative discrete scenario approach to compare outcomes for two different general approaches to sustainable development (promotion of economic growth and public goods versus proactive management of ecosystems and their services) under two different basic futures (expanding globalization versus increasing regionalization) (ME Assessment 2005, Scenarios Assessment Report). This resulted in four different possible future states (see Figure 24 below), for which they then used interviews with international leaders and thinkers and other qualitative information to assess the risk of extreme ecosystem events (those affecting >1 million people) in each scenario.
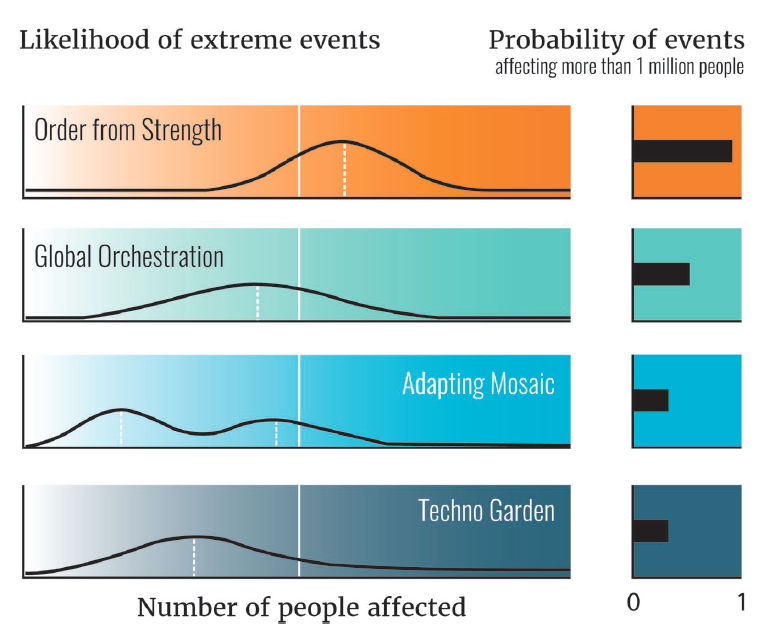
Figure 24, adapted from the Millennium Ecosystem Assessment Scenario Assessment Report (2005) with permission. Left column: Magnitude of extreme event (measured as the number of people affected) on the x-axis versus likelihood of events of a given magnitude, on the y-axis, for four different global development scenarios. Right column: Length of the bar indicates the annual probability of events that affect more than 1 million people.
Below we detail three additional examples of scenario and tradeoff analysis to inform environmental management decisionmaking in the face of tipping points.
Weighing tradeoffs associated with reducing sediment runoff to reefs in West Maui, Hawaii
Increased runoff of sediment and pollutants from land threatens coral reef ecosystems around the world. These land-based source pollutants (LBSP) have been linked to degradation on some Hawaiian reefs. As an example of how to quantitatively evaluate management options for reducing key drivers of reef change, we developed a decision support tool that analyzes the costs and benefits of different management strategies aimed at reducing LBSP (Oleson et al. 2017). Specifically, we examined the tradeoffs, in terms of management cost and sediment reduction, among potential agricultural road repair management actions in West Maui, Hawai‘i. We identified the most cost-effective roads to repair (the most sediment reduction per dollar spent), and found significant cost savings associated with repairing these roads. We also found that the best environmental gains for lowest economic cost could be achieved if landowners cooperated, although the benefits of cooperation dissipate if landowners do not target cost-effective roads (See Figure 25 below).
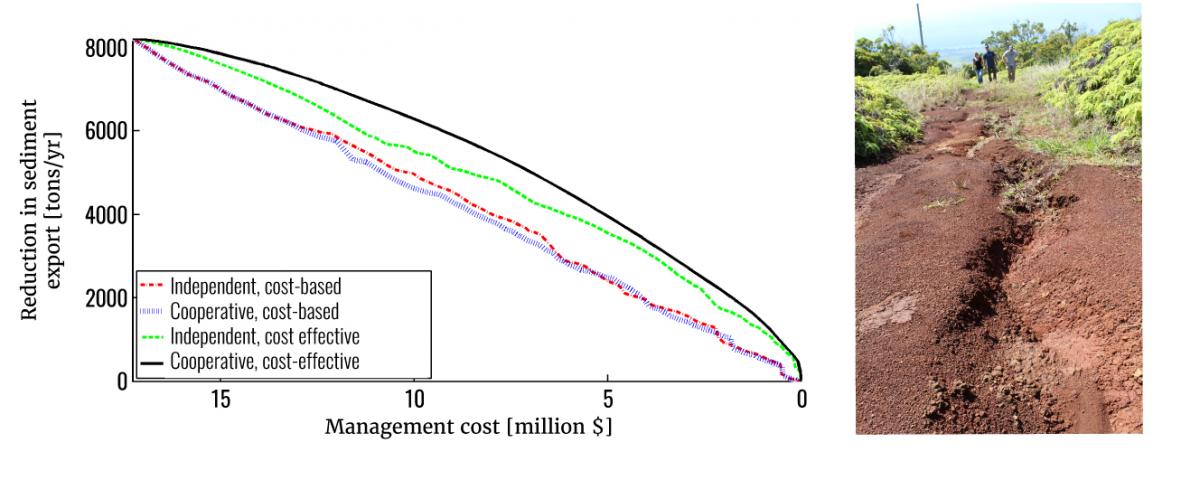
Figure 25, from Oleson et al. 2017 with permission. Each point represents a set of road segments to be repaired at a given cost, with a given reduction in sediment delivery to the coast. Colors represent whether landowners make decisions independently (red or green lines) or cooperatively (blue and black lines) and whether they choose roads for repair based on cost ($) or cost-effectiveness (tons of sediment reduced/$). The most efficient outcome is achieved with cooperative management targeting cost-effective road repairs (black line).
Informing target-setting for marine spatial planning in Puget Sound
Levin and co-authors (2015) developed a social-ecological framework for scenario evaluation and target-setting in social-ecological systems. Demonstrating the approach in eelgrass ecosystems of Puget Sound, they illustrate how to determine people’s preferences and willingness to accept specific management actions (i.e., risk tolerance). Puget Sound makes up a unique estuarine system that is valued for its beauty and ecological importance. Like other marine and estuarine ecosystems, Puget Sound supports a variety of human activities, leading to some degradation of the processes supporting its ecosystem. Eelgrass is a particularly important habitat in Puget Sound, highly valued for its ecological and economic benefits. The authors estimated changes in eelgrass in Puget Sound related to a variety of potential changes in human activities using expert elicitation and Bayesian network analysis to generate the relationships between changing human activities, different drivers, and eelgrass. They then developed seven scenarios based on alternative futures analyses of the system, including changes in growth management, transportation, and land use patterns, as well as projected changes in sediment and nutrient inputs, shoreline armoring and overwater structures. These seven scenarios projected changes in the state of the social-ecological system, linking the changes in eelgrass with changes to a food web model that evaluated how eelgrass influenced the ecological community. Applying these seven scenarios, the authors examined trade-offs among 16 metrics, including seven biological indicators, four human stressor metrics, two metrics of development, and three indicators of economic costs. To identify people’s preferences and willingness to accept the social-ecological outcomes from these scenarios, the authors generated social norm curves, where stakeholder preferences are linked to the social-ecological state (represented by the 16 metrics) from each scenario (Figure 27). They interviewed 128 individuals representing major stakeholder groups in the region, exposing the participants to the outcomes of the scenarios using two approaches: (a) radar plots that visualize trade-offs among the metrics (Figure 23), and (b) stylized images that provided visualization of the different states of the ecosystem (Figure 26). Participants were asked to score the desirability of each scenario on a Likert scale from -2 (completely unacceptable) to +2 (optimal state). This allowed the researchers to identify the minimally acceptable state, the unacceptable states, and the participants’ overall most preferable state, which was an increase of between 10% and 25% of eelgrass (Figure 27). The outputs from this approach could be used to inform management targets in the region.
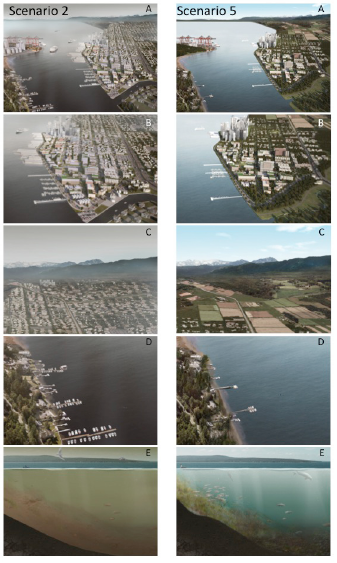 Figure 26, from Levin et al 2015 with permission. Examples of the visualizations used to examine the desired state of the social-ecological system. Depicted are an (A) overview, (B) urban center, (C) outlying region (rural growth and open space), (D) shoreline, and (E) subtidal marine environment for a stylized Puget Sound metropolis. Two scenarios are illustrated: scenario 2 in which growth is unconstrained and population rapidly grows, and scenario 5 in which growth is managed through a set of land-use policies.
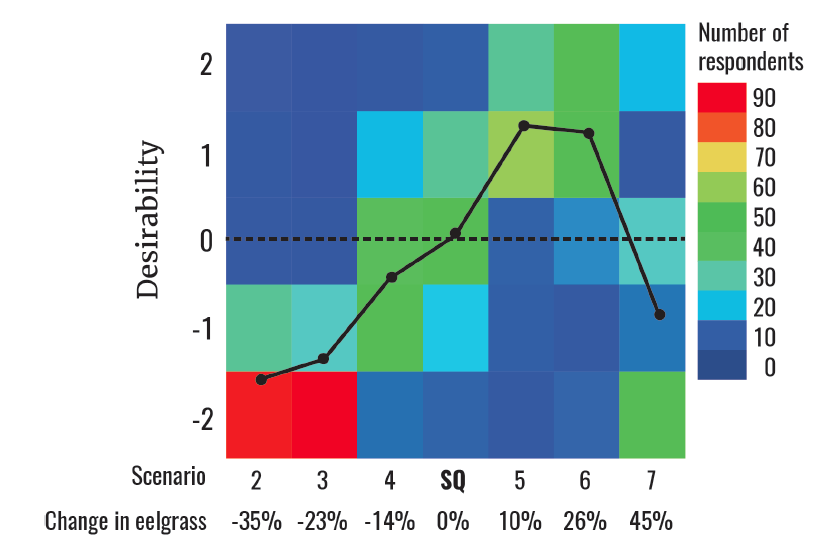
Figure 27, from Levin et al. 2015 with permission. A social norm curve showing desirability of seven development scenarios (and associated changes in eelgrass) on a Likert scale from -2 (completely unacceptable) to +2 (optimal state). The line depicts the average desirability of each scenario; the colors show the frequency distribution of responses to each scenario.
Investigating social preferences for herring management in Haida Gwaii
Building on the methods of Levin et al. (2015), our team conducted scenario workshops with stakeholders in Haida Gwaii to explore people’s preferences around Pacific herring fisheries management. Interviews with Haida (the First Nation resident in Haida Gwaii for ~13,000 years) elders and community members informed our understanding of the linkages between herring and a variety of ecological, social and cultural dimensions (Poe et al. in prep). These linkages were further refined and quantified by Poe and colleagues through small focus group expert elicitation (Poe et al. in prep). Experts helped to quantify (on a 5 point Likert scale) the linkages between herring spatial distribution and biomass and each of four social benefits tied to herring for both Haida (via the traditional food fishery and/or commercial spawn on kelp fishery) and non-Haida stakeholders (via commercial spawn on kelp and/or gillnet or seine fisheries). The four benefits they scored were ability to practice harvest; access to herring eggs on kelp (k’aaw) for food and feasts; social relationships; and connections to herring, its places and the herring environment.
An existing Ecopath model of the ecosystem (Ainsworth et al. 2014) was modified to examine ecological changes that would result from changes in herring biomass under 13 different fishing scenarios (Levin et al. in prep). We then provided workshop participants with visual, graphical and written descriptions of how herring, other species, and social values could be expected to change under each scenario and asked them to rank the desirability of each scenario on a Likert scale. Aspects of governance, access, and the spatial distribution of fishing and processing activities were also included in the scenarios. Results of these workshops help to clarify community preferences for how herring fishing should be managed in Haida Gwaii.
Conclusion
In this Guide, we have laid out four strategies for incorporating knowledge about ocean tipping points into your existing management decision-making. We have embedded these steps into a general adaptive management framework model that is widely used throughout natural resource management. This serves to not only make it easier to embed these steps into any ongoing adaptive management process you may be undertaking, but also to show that tipping points science can help you accomplish the tasks you may have already laid out in any adaptive management context. As an example of how these steps lend themselves to other resource management processes, in the box below we show how our four step process maps onto the Fishery Ecosystem Plan loop developed by the Lenfest Fishery Ecosystem Task Force in 2016.
Box 4. Integrating with existing management processes
|
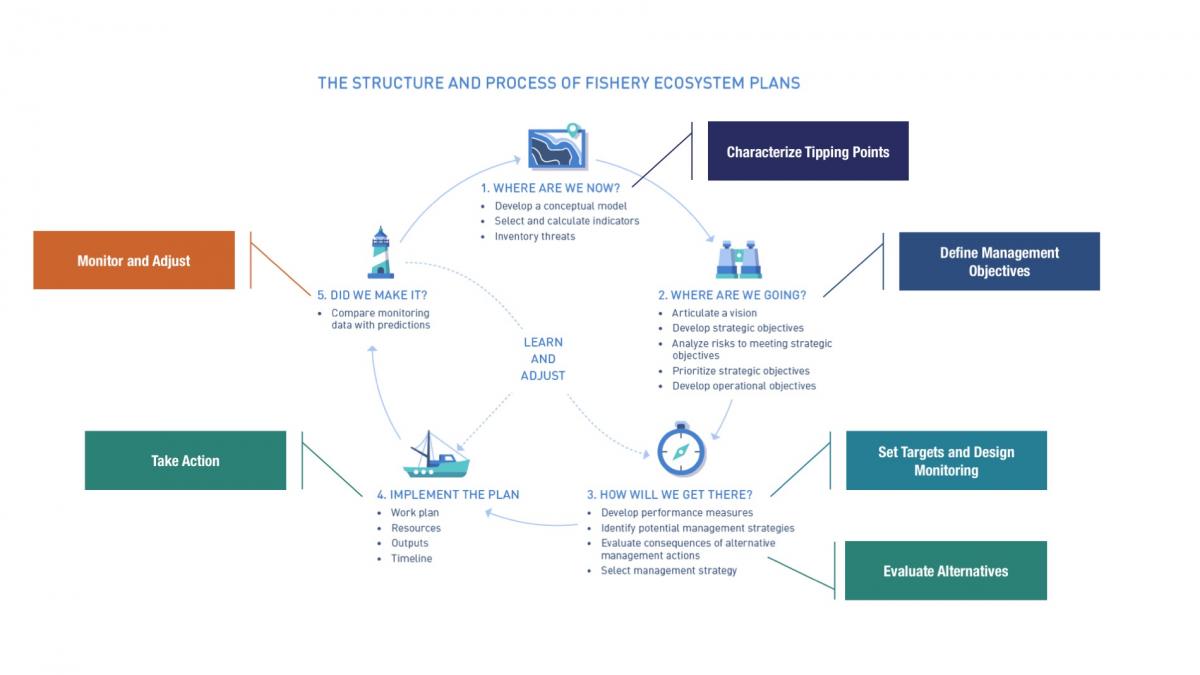
The Fishery Ecosystem Plan Loop The main recommendation of the Task Force report is that Fishery Ecosystem Plans (FEP) be developed to create a structured process for establishing ecosystem goals within fisheries management and translating them into action. The FEP Loop is presented as the conceptual framework for planning and implementation. While the terminology used in the FEP Loop and the OTP Process may differ, the ideas and order of operations included in these plans mirror one another closely.
Where are we now? = Characterize Tipping Points Where are we going? = Define Management Objectives How will we get there? = Set Targets and Design Monitoring, and Evaluate Alternatives Implement the plan = Take Action Did we make it? = Monitor and Adjust |
From characterizing tipping points, to defining management objectives, setting targets, and designing monitoring programs, we hope this guide has helped you identify ways you can incorporate tipping points science into your own ecosystem evaluation and management. The methods, themes, and concepts presented in this guide are not meant to be prescriptive, but instead offer new ways of addressing long-standing, commonly-encountered ecosystem management problems. While tipping points in marine social-ecological systems change the rules of the game, the tools and concepts presented here can help you to anticipate, avoid, or recover from these dramatic changes.
Above all else, we hope that this guide can provide an accessible and interesting foundation in tipping points science and concepts upon which to build more successful and adaptable management solutions.